Check problematic events with the Windows Reliability Monitor
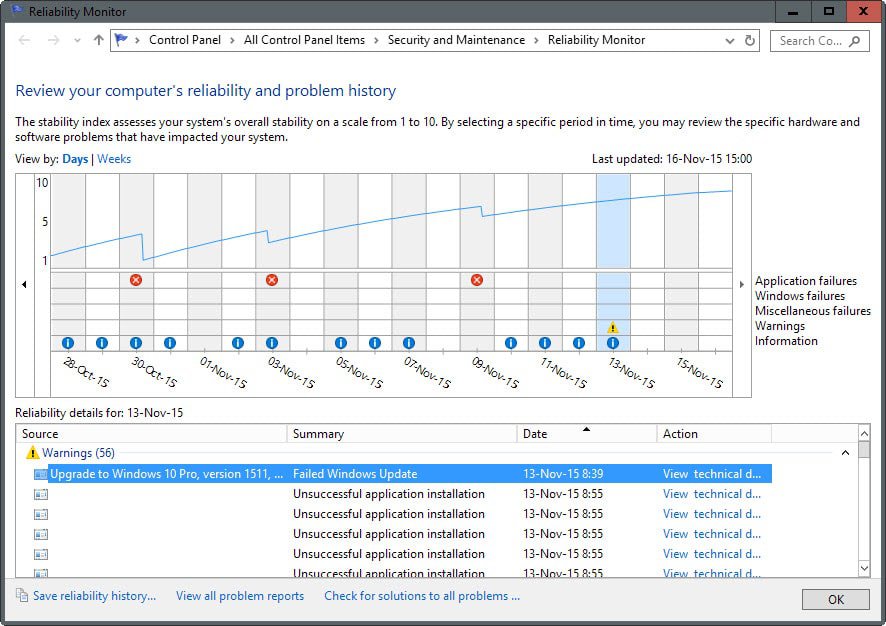
While you will notice some problematic events while you are using a system running a recent version of the Windows operating system, you may miss others.
For instance, if the web browser that you are using stops working, you will notice it and if that happens regularly, may investigate the cause to fix it. You may however fail to notice the same for background programs, especially if they are restarted automatically or other failures such as updates that don't get installed successfully.
The Windows Event log is without doubt the main tool to find out more about errors and their causes, but it is not the only one.
Since it is not that easy to find your way around in the program, you may prefer to use other tools instead initially, and one of them is the Reliability Monitor.
The Windows Reliability Monitor highlights a number of successful and unsuccessful events when started, and classifies them as critical, warning or informational in its interface.
To make things even simpler, it highlights all three of those in the timeline that it displays on start so that you can see on a glance what needs your attention and what does not.
- Critical: These events include application and Windows failures, for instance when an application stopped working, when a Windows component returned an error or when hardware failed.
- Warnings: These are warning messages, for instance when an update could not be installed or an application upgraded or installed.
- Informational: These list successful events, for instance installation of Windows Updates.
A click on a day in the timeline displays all events for that day. Since you can select days based on icons in the timeline, it is simple to look up critical events first and then warnings.
This can be useful after you have experienced an issue, but also for checking up on issues that you are not necessarily aware of.
Some are easy enough to ignore, for instance failed Windows Updates that went through on the second try while others may require your attention. Frequent application failures fall into that category, especially if you use the program regularly.
Each event is listed with its name, a summary, time and date, and a suggested action. For instance, you may see that Internet Explorer stopped working on a specific date, and that you may use the action to find a solution online.
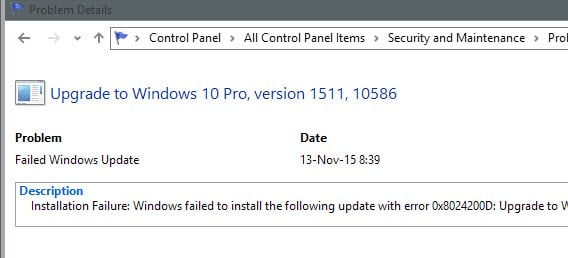
The action may not be helpful all the time, but sometimes they link to additional information. Failed Windows Updates may reveal for instance an error code that you can use to investigate the issue.
You may then use the error code or description to resolve the issue. For instance, you may run a search on the Internet to find out more about it, or hop over to the Event Viewer where you may find additional information such as system or event data.
How to start the Reliability Monitor
There are numerous ways to start the Windows Reliability Monitor. The following method works on all supported versions of Windows (meaning Vista and up).
- Tap on Windows-r to open the Run Box.
- Type perfmon /rel
- Hit enter.
Closing Words
The Windows Reliability Monitor offers a quick overview of important system events that may require your attention. Since it may display important events that you are not aware of, it is suggested to check it regularly (or a comparable tool) to make sure that critical issues don't slip by you and cause issues further down the line.
If you are using windows 7, check out our review of the Windows 7 Reliability Monitor here for additional information.
Now You: Do you check event logs or reliability information regularly?




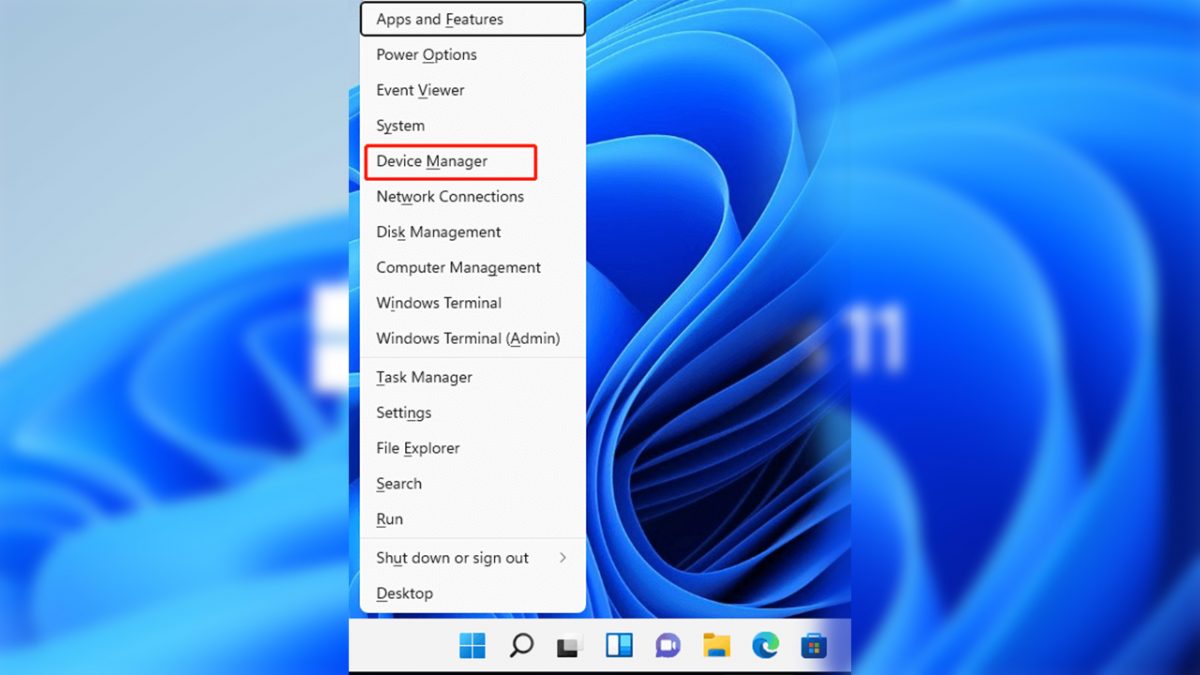




Why not use the eventmgr.msc? This is a lot of better because you get additional output on problematic events, can filter it and copy it to e.g. do google research based on your given problems. I think this is a better and more detailed solution, especially because you can also export the list.
Thanks Martin, this will come in handy.
There’s a typo on the command line. It should be `perfmon /rel` rather than ‘perform / rel`
Thanks, I have corrected this already ;)
Doesn’t work for me either – I’m on Windows 7 Ultimate x64
perform / rel doesn’t work. I’m on Windows 10 1511.
Sorry, it should read Type perfmon /rel